Graphics and Visualization
Intro
The chemlab.graphics package is one of the most interesting aspects of chemlab, that sets him apart from similar programs.
The purpose of the package is to provide a solid library to develop 3D applications to display chemical data in an flexible way. For example it’s extremely easy to build a molecular viewer and add a bunch of custom features to it.
The typical approach when developing a graphics application is to create a QtViewer instance and add 3D features to it:
>>> from chemlab.graphics import QtViewer
>>> v = QtViewer()
now let’s define a molecule. We can use the moldb module to get a water template.
>>> from chemlab.graphics.renderers import SphereRenderer
>>> from chemlab.data.moldb import water
>>> ar = v.add_renderer(AtomRenderer, water.r_array, water.type_array)
>>> v.run()
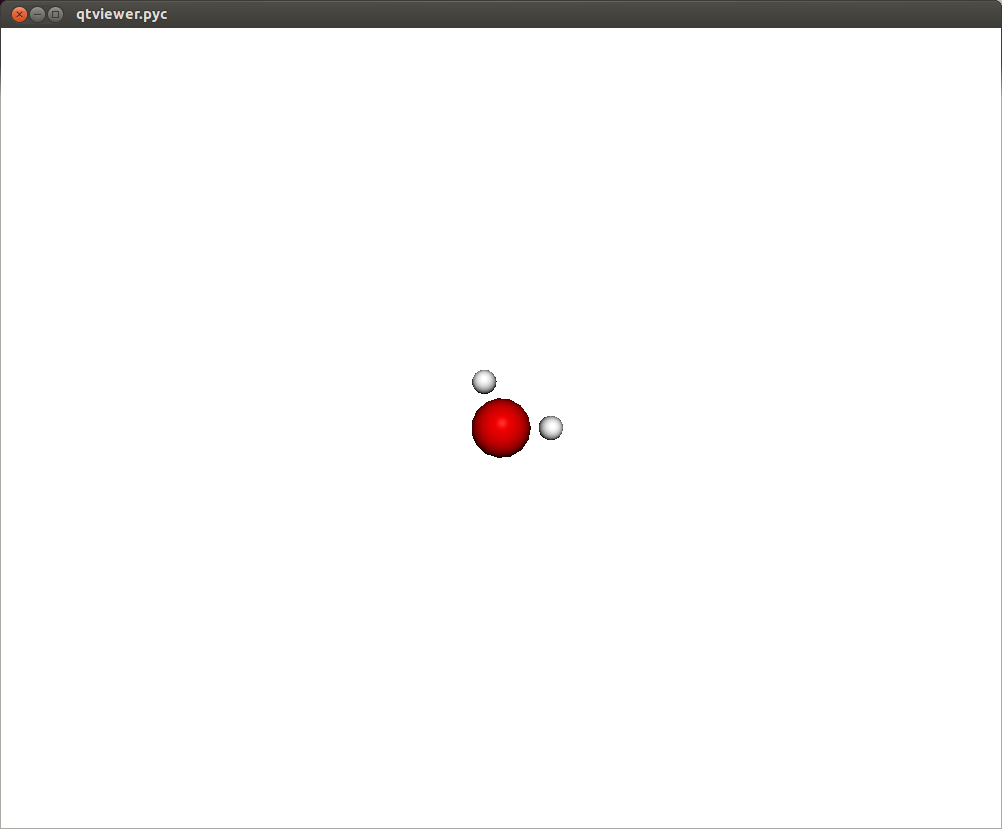
In this way you should be able to visualize a molecule where each atom is represented as a sphere. There are also a set of viewing controls:
- Mouse Drag (Left Click) or Left/Right/Up/Down: Rotate the molecule
- Mouse Drag (Right Click): Pan the view
- Mouse Wheel or +/-: Zoom in/out
In a similar fashion it is possible to display other features, such as boxes, arrows, lines, etc. It is useful to notice that with Viewer.add_renderer we are not passing an instance of the renderer, but we’re passing the renderer class and its respective constructor arguments. The method Viewer.add_renderer returns the actual instance.
It is possible as well to overlay 2D elements to a scene in a similar fashion, this will display a string at the screen position 300, 300:
from chemlab.graphics.uis import TextUI
tui = v.add_ui(TextUI, 300, 300, "Hello, World!")
Anyway, I encourage you to use the powerful Qt framework to provide interaction and widgets to your application.
Renderers
Renderers are simply classes used to draw 3D objects. They are tecnically required to provide just one method, draw and they must take an instance of QChemlabWidget as their first argument (check out the AbstractRenderer class). In this way they provide the maximum flexibility required to build efficient opengl routines. Renderers may be subclass other renderers as well as use other renderers.
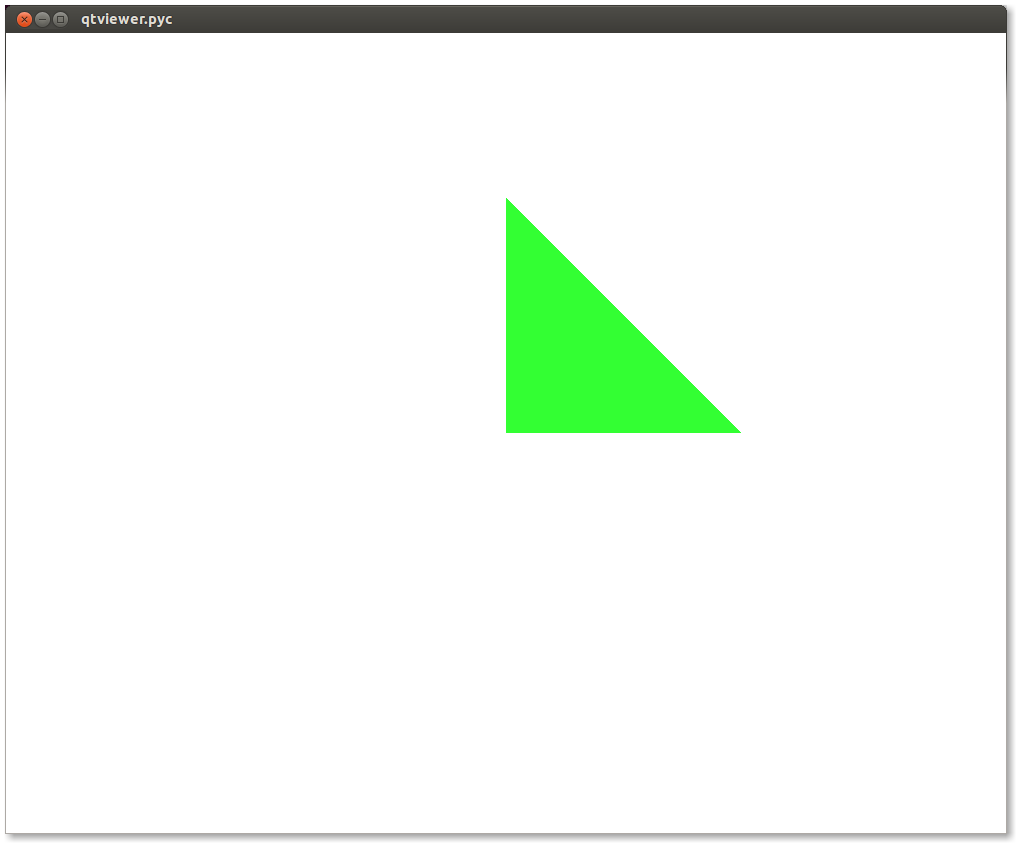
A very useful renderer is TriangleRenderer, used to render efficiently a list of triangles, it constitutes a base for writing other renderers. TriangleRenderer works basically like this, you pass the vertices, normals and colors of the triangle and it will display a triangle in the world:
from chemlab.graphics import QtViewer
from chemlab.graphics.renderers import TriangleRenderer
from chemlab.graphics.colors import green
import numpy as np

vertices = np.array([[0.0, 0.0, 0.0], [0.0, 1.0, 0.0], [1.0, 0.0, 0.0]])
normals = np.array([[0.0, 0.0, 1.0], [0.0, 0.0, 1.0], [0.0, 0.0, 1.0]])
colors = np.array([green, green, green])

v = QtViewer()
v.add_renderer(TriangleRenderer, vertices, normals, colors)
v.run()
If you pass 6 vertices/normals/colors, he will display 2 triangles and so on. As a sidenote, he is very efficient and in fact chemlab.graphics.renderers.TriangleRenderer is used as a backend for a lot of other renderers such as SphereRenderer and CylinderRenderer. If you can reduce a shape in triangles, you can easily write a renderer for it.
In addition to that, TriangleRenderer provides also a method to update vertices, normals and colors. We can demonstrate that from the last example by defining an update function that rotates our triangle:
from chemlab.graphics.transformations import rotation_matrix

def update():
    y_axis = np.array([0.0, 1.0, 0.0])

    # We take the [:3,:3] part because rotation_matrix can be used to
    # rotate homogeneous (4D) coordinates.
    rot = rotation_matrix(3.14/32, y_axis)[:3, :3]

    # This is the numpy-efficient way of applying rot to each coordinate
    vertices[:] = np.dot(vertices, rot.T)
    normals[:] = np.dot(vertices, rot.T)

    tr.update_vertices(vertices)
    tr.update_normals(normals)
    v.widget.repaint()

v.schedule(update, 10)
v.run()
On this ground we can develop a TetrahedronRenderer based on our TriangleRenderer. To do that we first need to understand how a tetrahedron is made, and how can we define the vertices that make the tetrahedron.
Tutorial: TetrahedronRenderer
First of all, we need to have the 4 coordinates that represents a tetrahedron. Without even trying to visualize it, just pick the values straight from Wikipedia:
import numpy as np
v1 = np.array([1.0, 0.0, -1.0/np.sqrt(2)])
v2 = np.array([-1.0, 0.0, -1.0/np.sqrt(2)])
v3 = np.array([0.0, 1.0, 1.0/np.sqrt(2)])
v4 = np.array([0.0, -1.0, 1.0/np.sqrt(2)])
We can quickly verify if this is correcty by using a PointRenderer:
from chemlab.graphics import QtViewer
from chemlab.graphics.renderers import PointRenderer
from chemlab.graphics.colors import black, green, blue, red

colors = [black, green, blue, red]
v = QtViewer()
v.add_renderer(PointRenderer, np.array([v1, v2, v3, v4]), colors)
v.run()
We’ve got 4 boring points that look like they’re at the vertices of a tetrahedron. Most importantly we learned that we can use PointRenderer to quickly test shapes.
Now let’s define the four triangles (12 vertices) that represent a solid tetrahedron. It is good practice to put the triangle vertices in a certain order to estabilish which face is pointing outside and which one is pointing inside for optimization reasons. The convention is that if we specify 3 triangle vertices in clockwise order this means that the face points outwards from the solid:
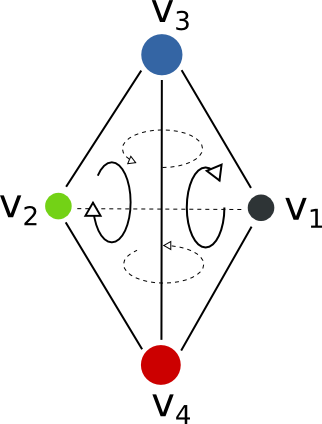
We can therefore write our vertices and colors:
vertices = np.array([
    v1, v4, v3,
    v3, v4, v2,
    v1, v3, v2,
    v2, v4, v1
])

colors = [green] * 12
All is left to do is write the normals to the surface at each vertex. This is easily done by calculating the cross product of the vectors constituting two sides of a triangle, (remember that the normals should point outward):
n1 = -np.cross(v4 - v1, v3 - v1)
n2 = -np.cross(v4 - v3, v2 - v3)
n3 = -np.cross(v3 - v1, v2 - v1)
n4 = -np.cross(v4 - v2, v1 - v2)

normals = [n1, n1, n1,
           n2, n2, n2,
           n3, n3, n3,
           n4, n4, n4]

from chemlab.graphics.renderers import TriangleRenderer

v.add_renderer(TriangleRenderer, vertices, normals, colors)
v.run()
Now that we’ve got the basic shape in place we can code the actual Renderer class to be used directly with the viewer. We will make a renderer that, given a set of coordinates will display many tetrahedra.
We can start by defining a Renderer class, inheriting from AbstractRenderer, the main thing you should notice is that you need an additional argument widget that will be passed when you use the method QtViewer.add_renderer:
from chemlab.graphics.renderers import AbstractRenderer

class TetrahedraRenderer(AbstractRenderer):
    def __init__(self, widget, positions):
        super(TetrahedraRenderer, self).__init__(widget)
        ...
The strategy to implement a multiple-tetrahedron renderer will be like this:
- store the triangle vertices, and normals of a single tetrahedra.
- for each position that we pass, translate the vertices of the single tetrahedra and accumulate the obtained vertices in a big array.
- repeat the normals of a single tetrahedra for the number of tetrahedra we’re going to render.
- generate the per-vertex colors (green for simplicity)
- create a TriangleRenderer as an attribute and initialize him with the accumulated vertices, normals, and colors
- reimplement the draw method by calling the draw method of our trianglerenderer.
You can see the code in this snippet:
class TetrahedraRenderer(AbstractRenderer):
    def __init__(self, widget, positions):
        super(TetrahedraRenderer, self).__init__(widget)

        v1 = np.array([1.0, 0.0, -1.0/np.sqrt(2)])
        v2 = np.array([-1.0, 0.0, -1.0/np.sqrt(2)])
        v3 = np.array([0.0, 1.0, 1.0/np.sqrt(2)])
        v4 = np.array([0.0, -1.0, 1.0/np.sqrt(2)])

        positions = np.array(positions)

        # Vertices of a single tetrahedra
        self._th_vertices = np.array([
            v1, v4, v3,
            v3, v4, v2,
            v1, v3, v2,
            v2, v4, v1
        ])

        self._th_normals = np.array([
            n1, n1, n1,
            n2, n2, n2,
            n3, n3, n3,
            n4, n4, n4])

        self.n_tetra = len(positions)

        tot_vertices = []
        for pos in positions:
            tot_vertices.extend(self._th_vertices + pos)

        # Refer to numpy.tile, this simply repeats the elements
        # of the array in an efficient manner.
        tot_normals = np.tile(self._th_normals, (self.n_tetra, 1))
        tot_colors = [green] * self.n_tetra * 12

        # !NOTICE! that we have to pass widget as the first argument
        self.tr = TriangleRenderer(widget, tot_vertices,
                                  tot_normals, tot_colors)

    def draw(self):
        self.tr.draw()
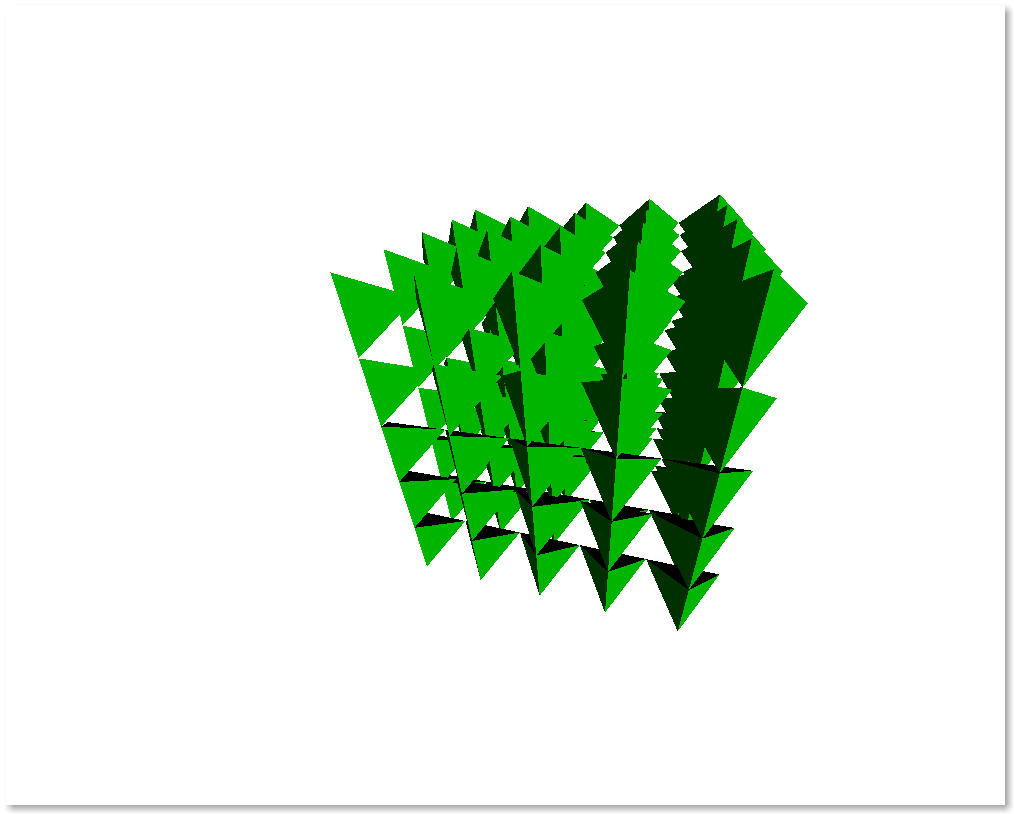
To demostrate let’s draw a grid of 125 tetrahedra:
positions = []

for x in range(5):
    for y in range(5):
        for z in range(5):
            positions.append([float(x)*2, float(y)*2, float(z)*2])

v.add_renderer(TetrahedraRenderer, positions)
v.widget.camera.position = np.array([0.0, 0.0, 20.0])
v.run()
If you had any problem with the tutorial or you want to implement other kind of renderers don’t exitate to contact me. The full code of this tutorial is in chemlab/examples/tetrahedra_tutorial.py.